Today is the final of the NCAA Men’s Basketball Tournament. It should be an exciting matchup between UConn and Michigan. This past weekend though, I was watching the 2026 Men’s Final Four and Michigan was blowing out Arizona in what was supposed to be the game of the year. At some point in the second half, the score was 74-47, and I noticed: that’s a palindrome! Concatenate the two scores and you get “7447”, which reads the same forwards and backwards. 74 is also 47 with its digits reversed. It’s the kind of thing you notice when one team is up by 27 points and the game itself has lost its drama.
This got me thinking. How common are palindrome scores? Intuition says that 74-47 is considerably less likely than, say, 45-54, since the former requires a blowout while the latter can happen in a closer 9-point game. But how much less likely? Using the hoopR package, which provides play-by-play data from ESPN for every D1 men’s basketball game going back to the 2005-2006 season, I set out to find out. We’ll use:
library("hoopR")
library("tidyverse")
library("stringi")
The load_mbb_pbp() function pulls play-by-play data from the hoopR data repository. Each row is a play event, with home_score and away_score columns reflecting the running score after each play. This is exactly what we need: not just final scores, but every score state a game passes through.
pbp <- load_mbb_pbp(seasons = 2006:2024)
This returns millions of rows across roughly 100,000+ games. We filter to scoring plays and keep only distinct score states per game, since the score doesn’t change on non-scoring events like rebounds or turnovers.
A score is a palindrome if concatenating the two scores produces a string that reads the same forwards and backwards. Since the score is displayed in two ways depending on which team is listed first (home-away or away-home), we check both orderings. I’m going to focus on what I’ll call “double-digit non-tie palindromes”: both scores must be two digits (so both teams have between 10 and 99 points), and the scores can’t be tied. This excludes trivially palindromic ties like 3-3 or 22-22, and single-digit palindromes like 12-1 → “121” that aren’t really digit reversals in the most satisfying sense. What we’re left with are the clean cases where one team’s score is the other team’s score’s digits reversed: 74-47, 54-45, 32-23, and so on. We have 162,848 of these!
palindromes <- pbp |>
  filter(scoring_play == TRUE) |>
  distinct(game_id, away_score, home_score, .keep_all = TRUE) |>
  mutate(
    score_str_HA = paste0(home_score, away_score),
    score_str_AH = paste0(away_score, home_score),
    is_palindrome = score_str_HA == stri_reverse(score_str_HA) |
                    score_str_AH == stri_reverse(score_str_AH)
  ) |>
  filter(is_palindrome)
We will also bring in information about final scores:
final_scores <- load_mbb_team_box(seasons = 2006:2024) |>
  select(game_id, team_home_away, team_score) |>
  pivot_wider(names_from = team_home_away, values_from = team_score,
              names_prefix = "final_")

palindromes <- palindromes |>
  left_join(final_scores, by = "game_id") |>
  mutate(is_final_score = away_score == final_away &
           home_score == final_home) |>
  select(-final_away, -final_home)
To build the distribution, we normalize by putting the higher score first (so 74-47 and 47-74 from different games get counted together), then count:
palindrome_dist <- palindromes |>
  filter(home_score != away_score,
         nchar(as.character(home_score)) == nchar(as.character(away_score))) |>
  mutate(
    lo = pmin(home_score, away_score),
    hi = pmax(home_score, away_score),
    score_label = paste0(hi, "-", lo)
  ) |>
  count(score_label, lo, hi, sort = TRUE)
Sorted by frequency, the pattern is not too surprising, but there are some interesting tidbits:
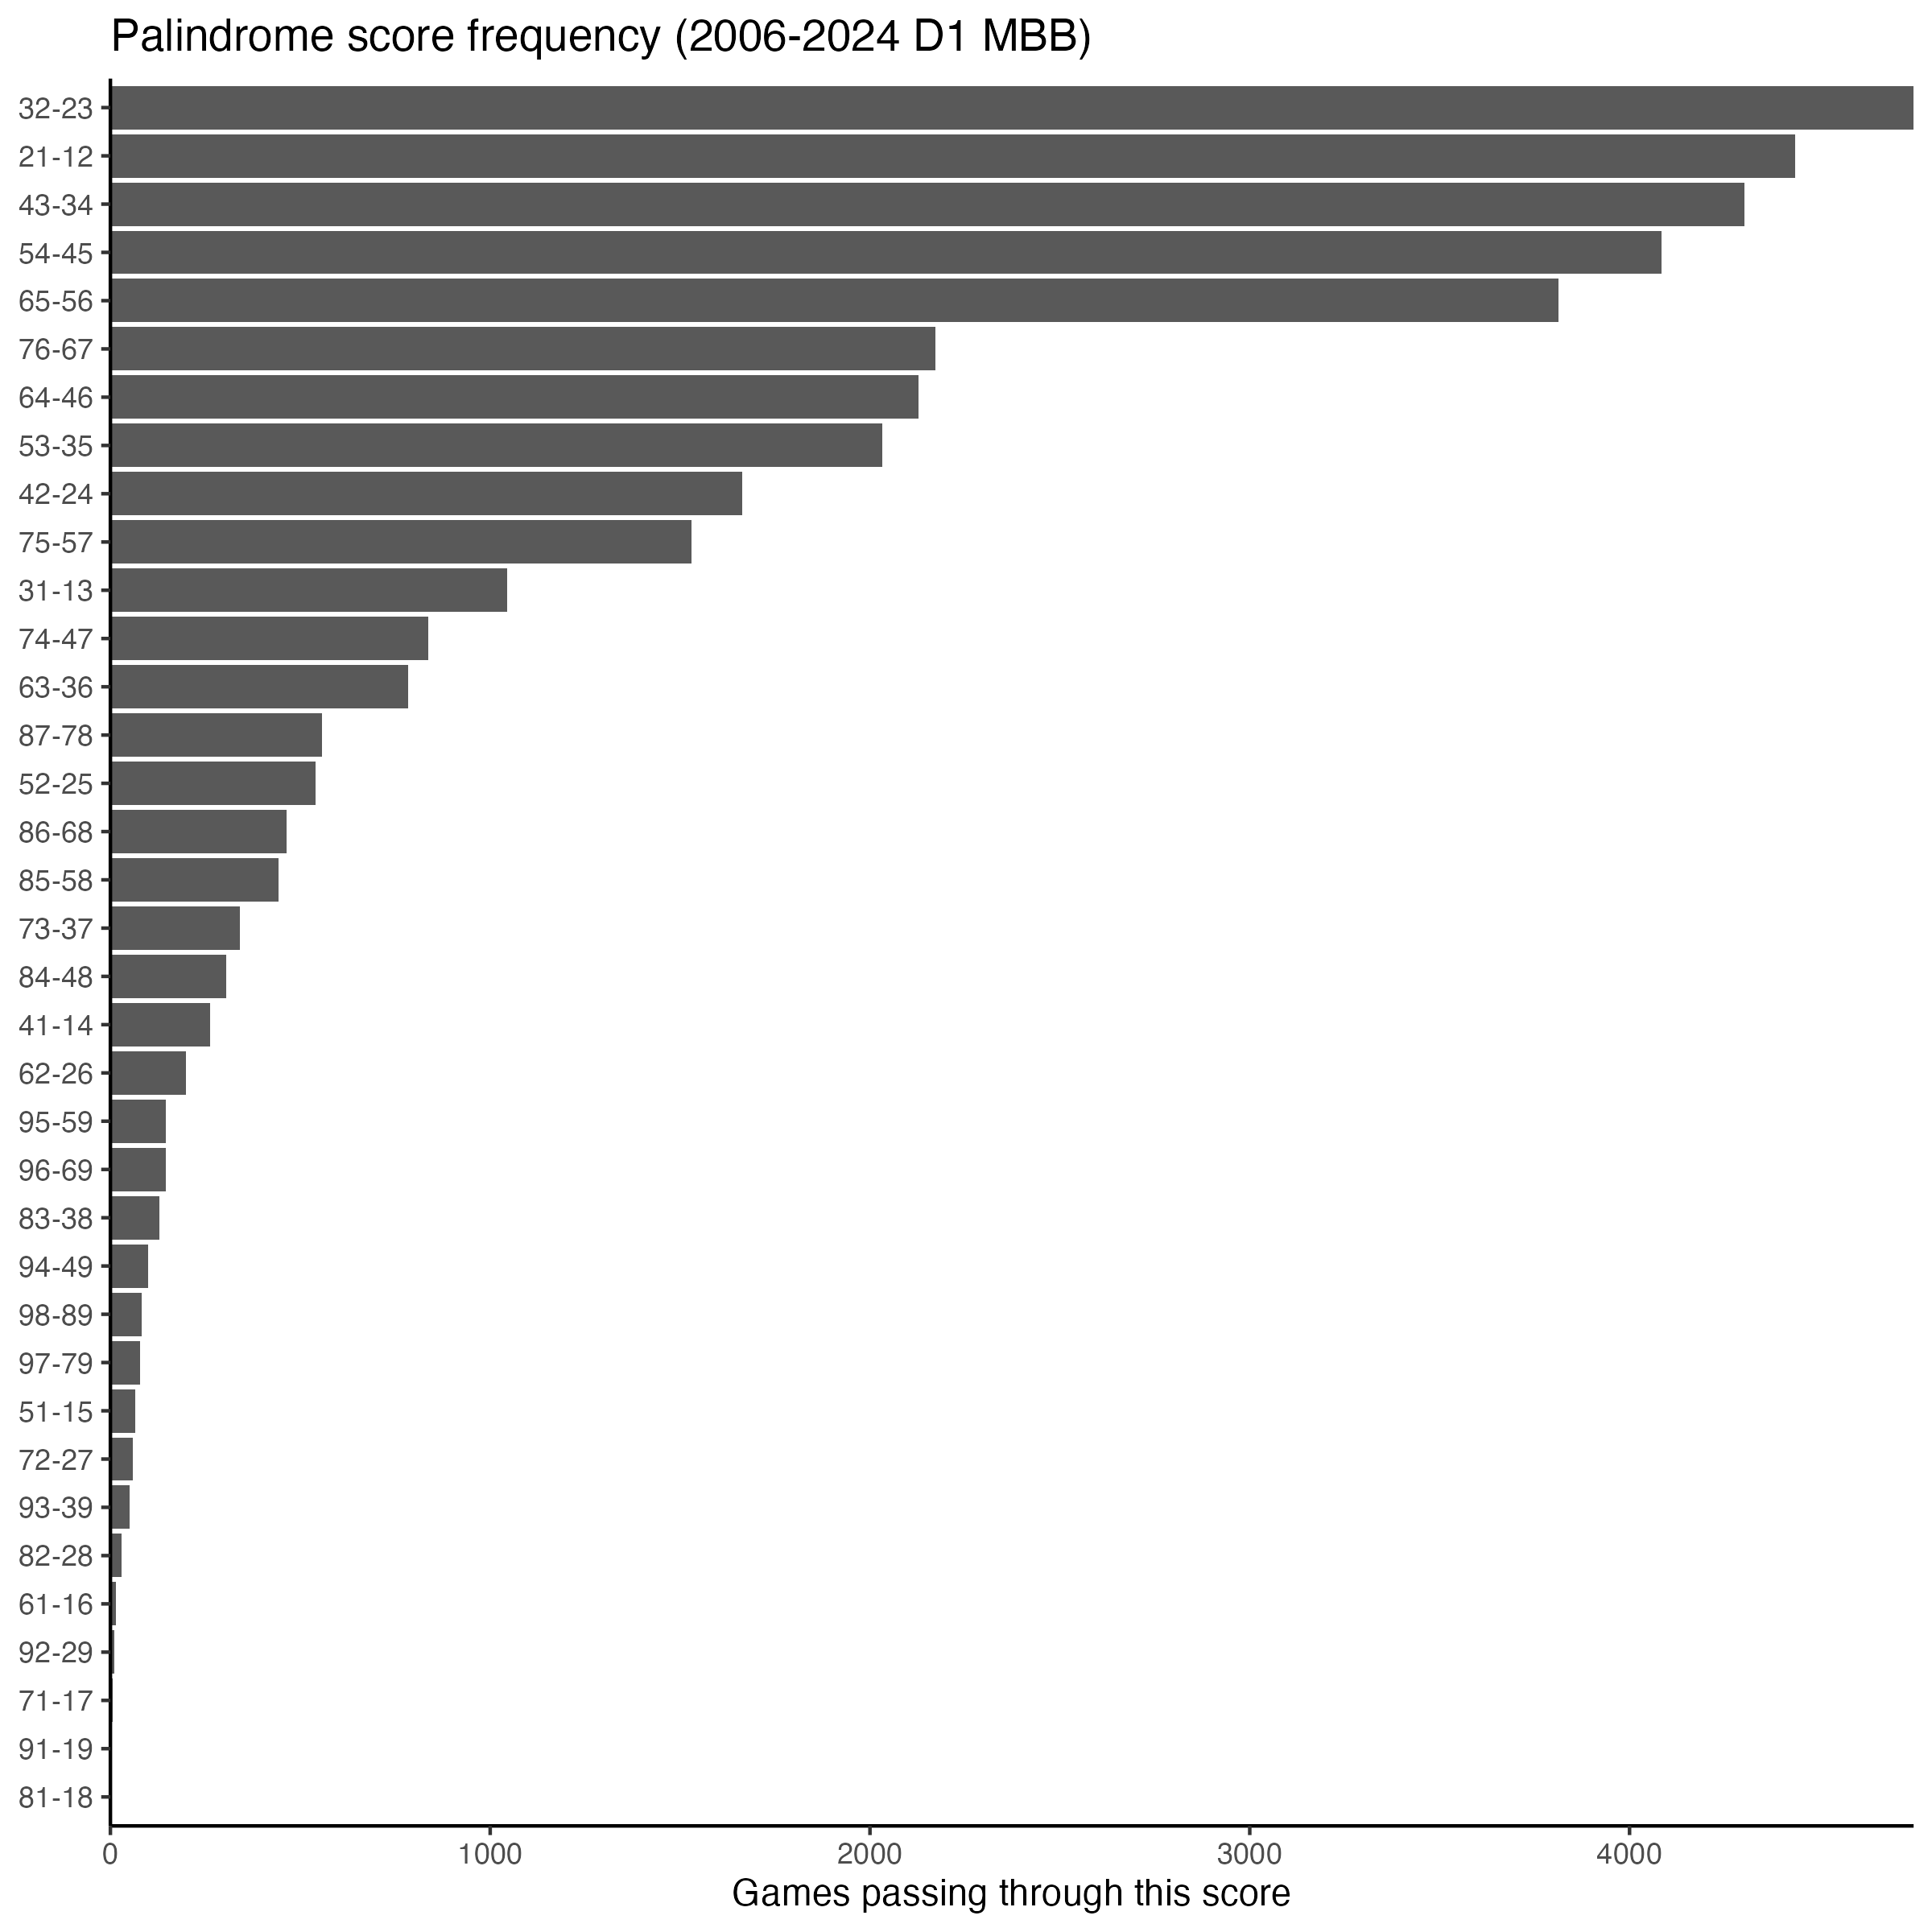
First, there are exactly 36 possible double-digit palindrome pairs, since both digits must be between 1 and 9, with the tens digit of the higher score strictly greater than that of the lower. All 36 appear in the data—even 91-19, which requires a 72-point gap and happened exactly twice: once on November 20, 2014 when UT Martin beat Champion Christian College, and once on December 20, 2022 when Sam Houston beat Arlington Baptist. The least likely palindrome overall is 81-18, which occurred just once: UNC Asheville vs. St. Andrews on November 28, 2021. Note that the gap between theoretical scores has a clean structure: if the higher score is $10a + b$ and the lower is $10b + a$, the gap is $9(a - b)$. So gaps are always multiples of 9. There are 8 possible palindromes with a 9-point gap (21-12 through 98-89), 7 with an 18-point gap (31-13 through 97-79), 6 with a 27-point gap, and so on down to the lone 72-point gap at 91-19.
Second, the most proximate palindromes—32-23, 21-12, 43-34, 54-45, 65-56—dominate overwhelmingly, each appearing in thousands of games. This makes sense: every game passes through a phase where the scores are close and in the teens, twenties, thirties, etc., and the digit-reversal pairs at those ranges are only 9 points apart. Interestingly, however, 32-23 edges out 21-12 for the top spot. This probably reflects the fact that games in the low teens are more volatile—a single 3-pointer or a quick run can skip past 21-12 entirely—whereas by the time both teams are in the twenties and thirties, scoring has settled into a steadier rhythm and the game is more likely to stabilize near a 9-point gap. The same pattern holds for larger gaps. The most likely 18-point palindrome is not the one with the lowest total score: 64-46 and 53-35 are both more likely than 31-13, for probably the same reasons. Some of the more common 18-point palindromes and even 27-point palindromes are more likely than the second least likely 9-point palindrome (87-78). There are even 36- and 45-point palindromes that are more likely than the least likely 9-point palindrome—unsurprisingly, 98-89—reflecting the lower-scoring nature of college basketball.
The same data sorted alphabetically by score reveals the structure even more clearly:
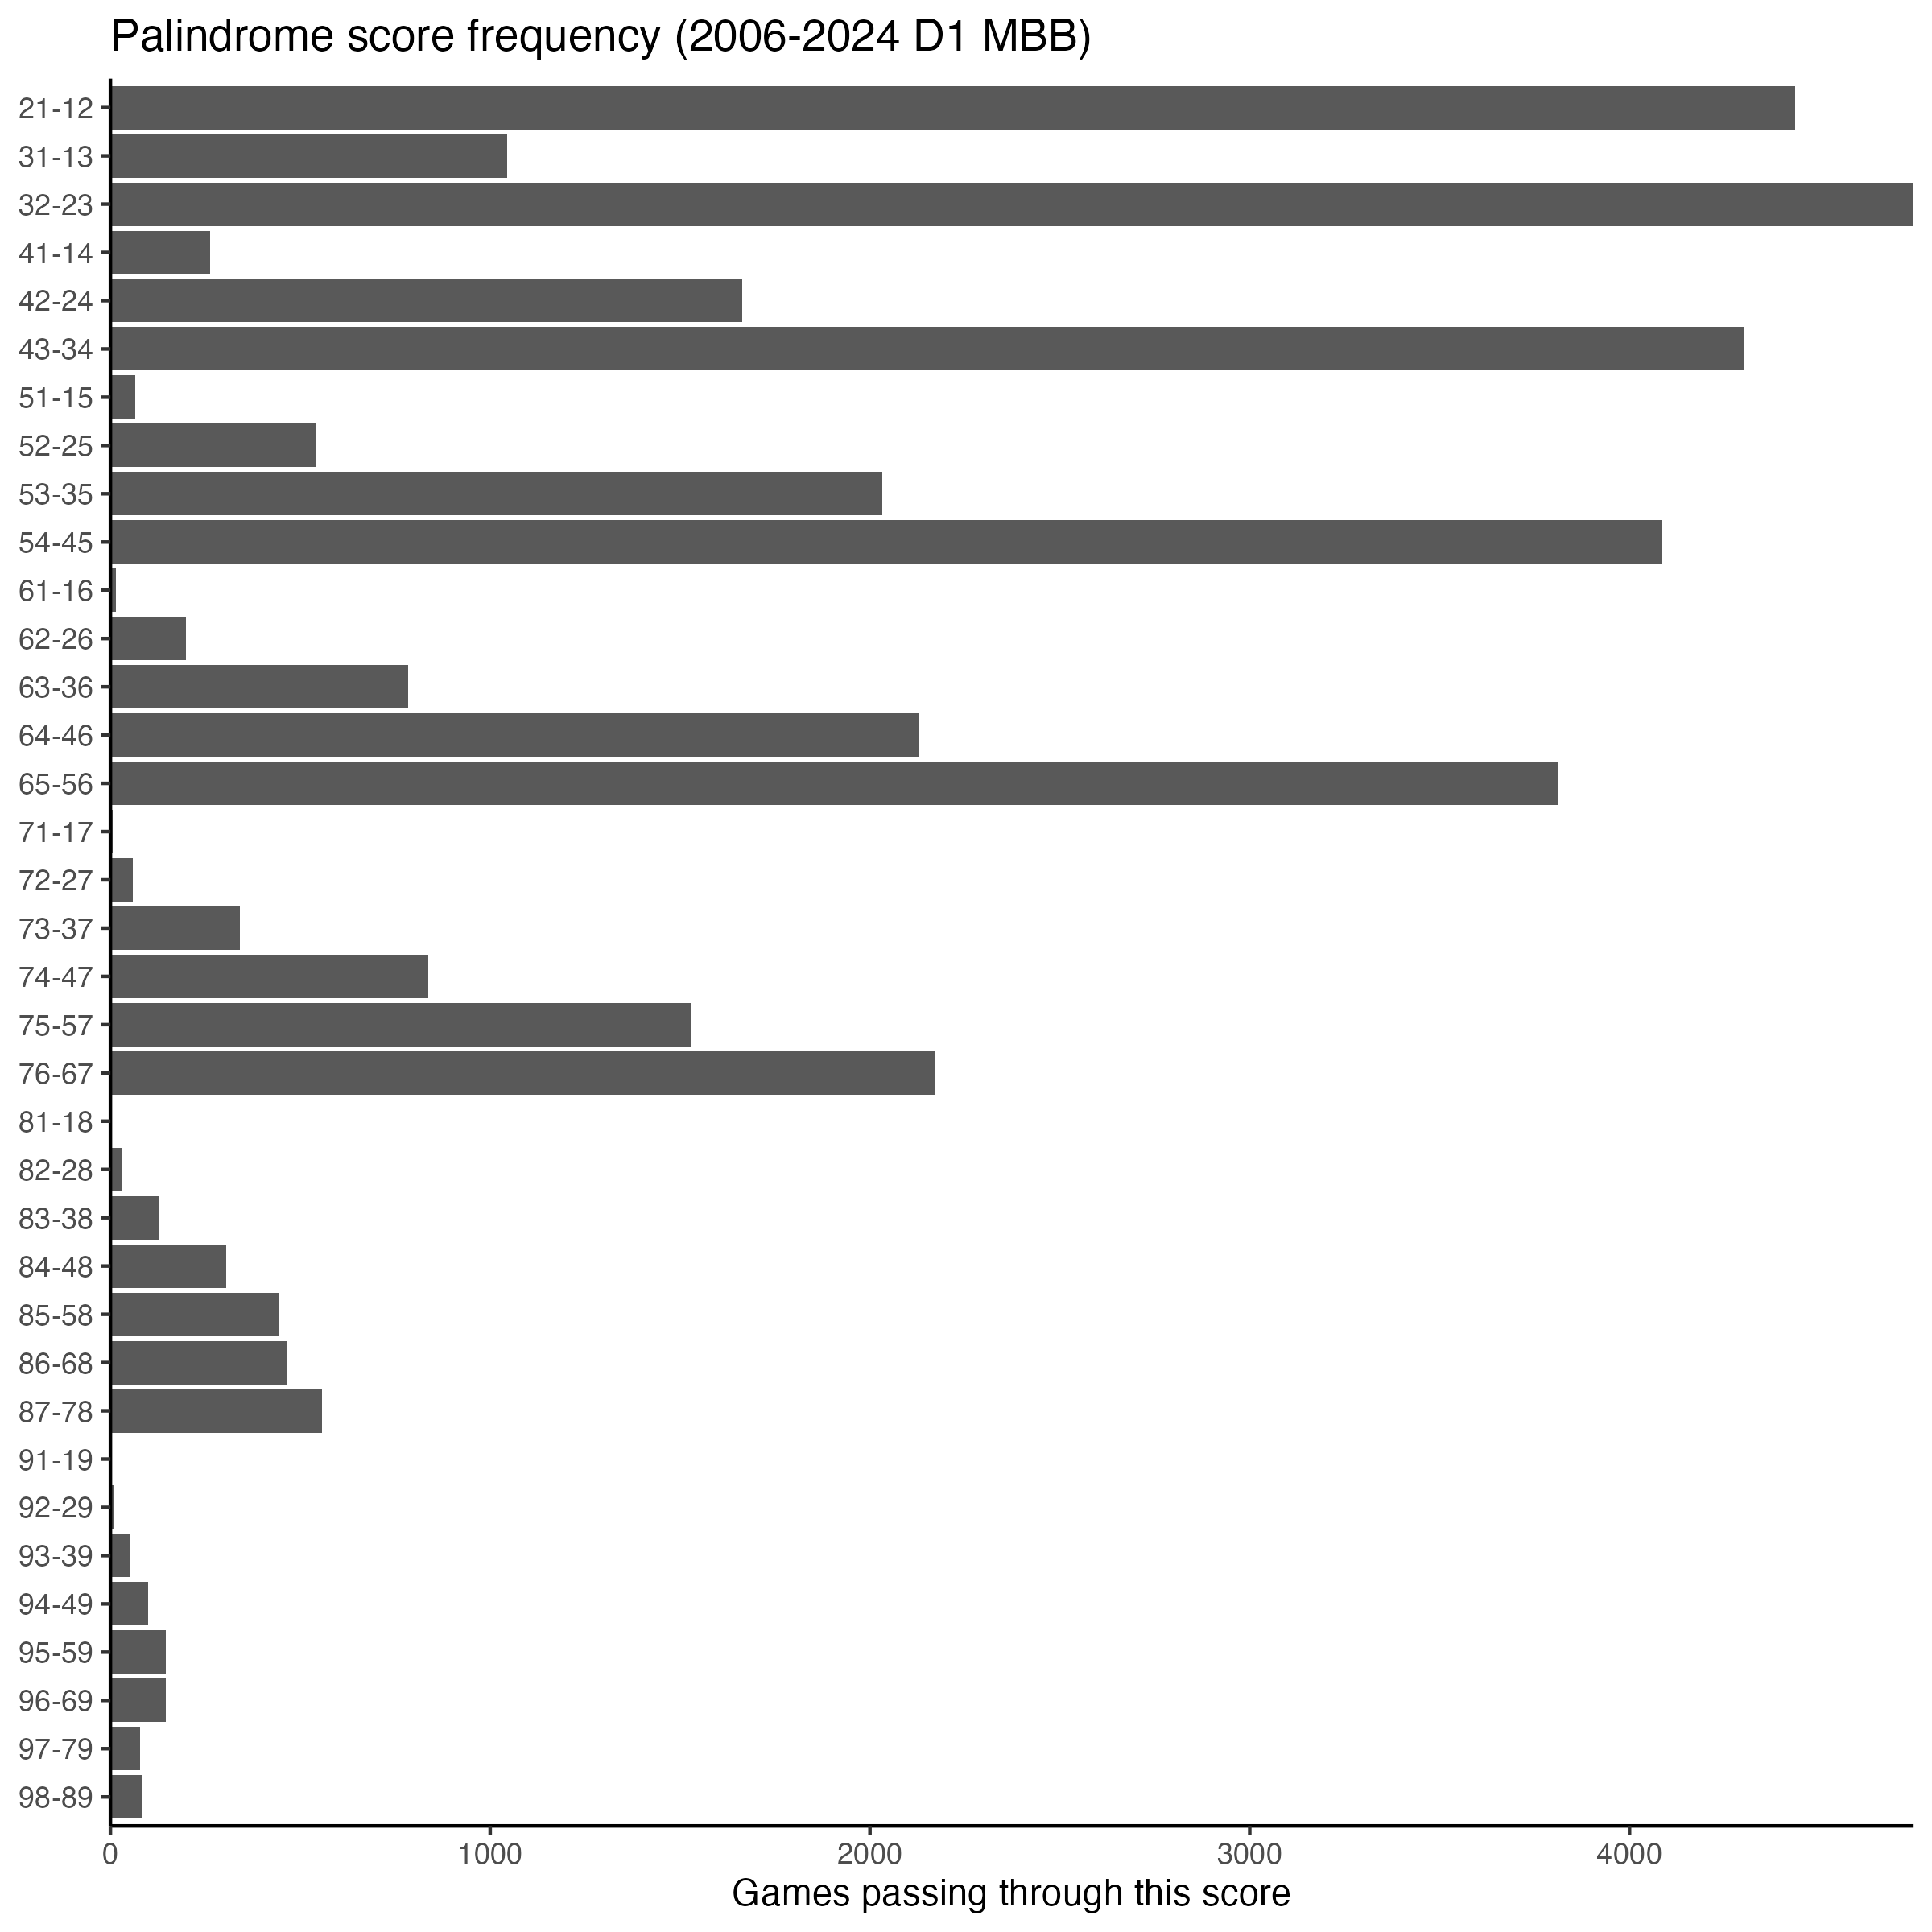
Within each “decade” of scores, the adjacent pair (like 32-23) is vastly more common than the wider gaps (like 31-13).
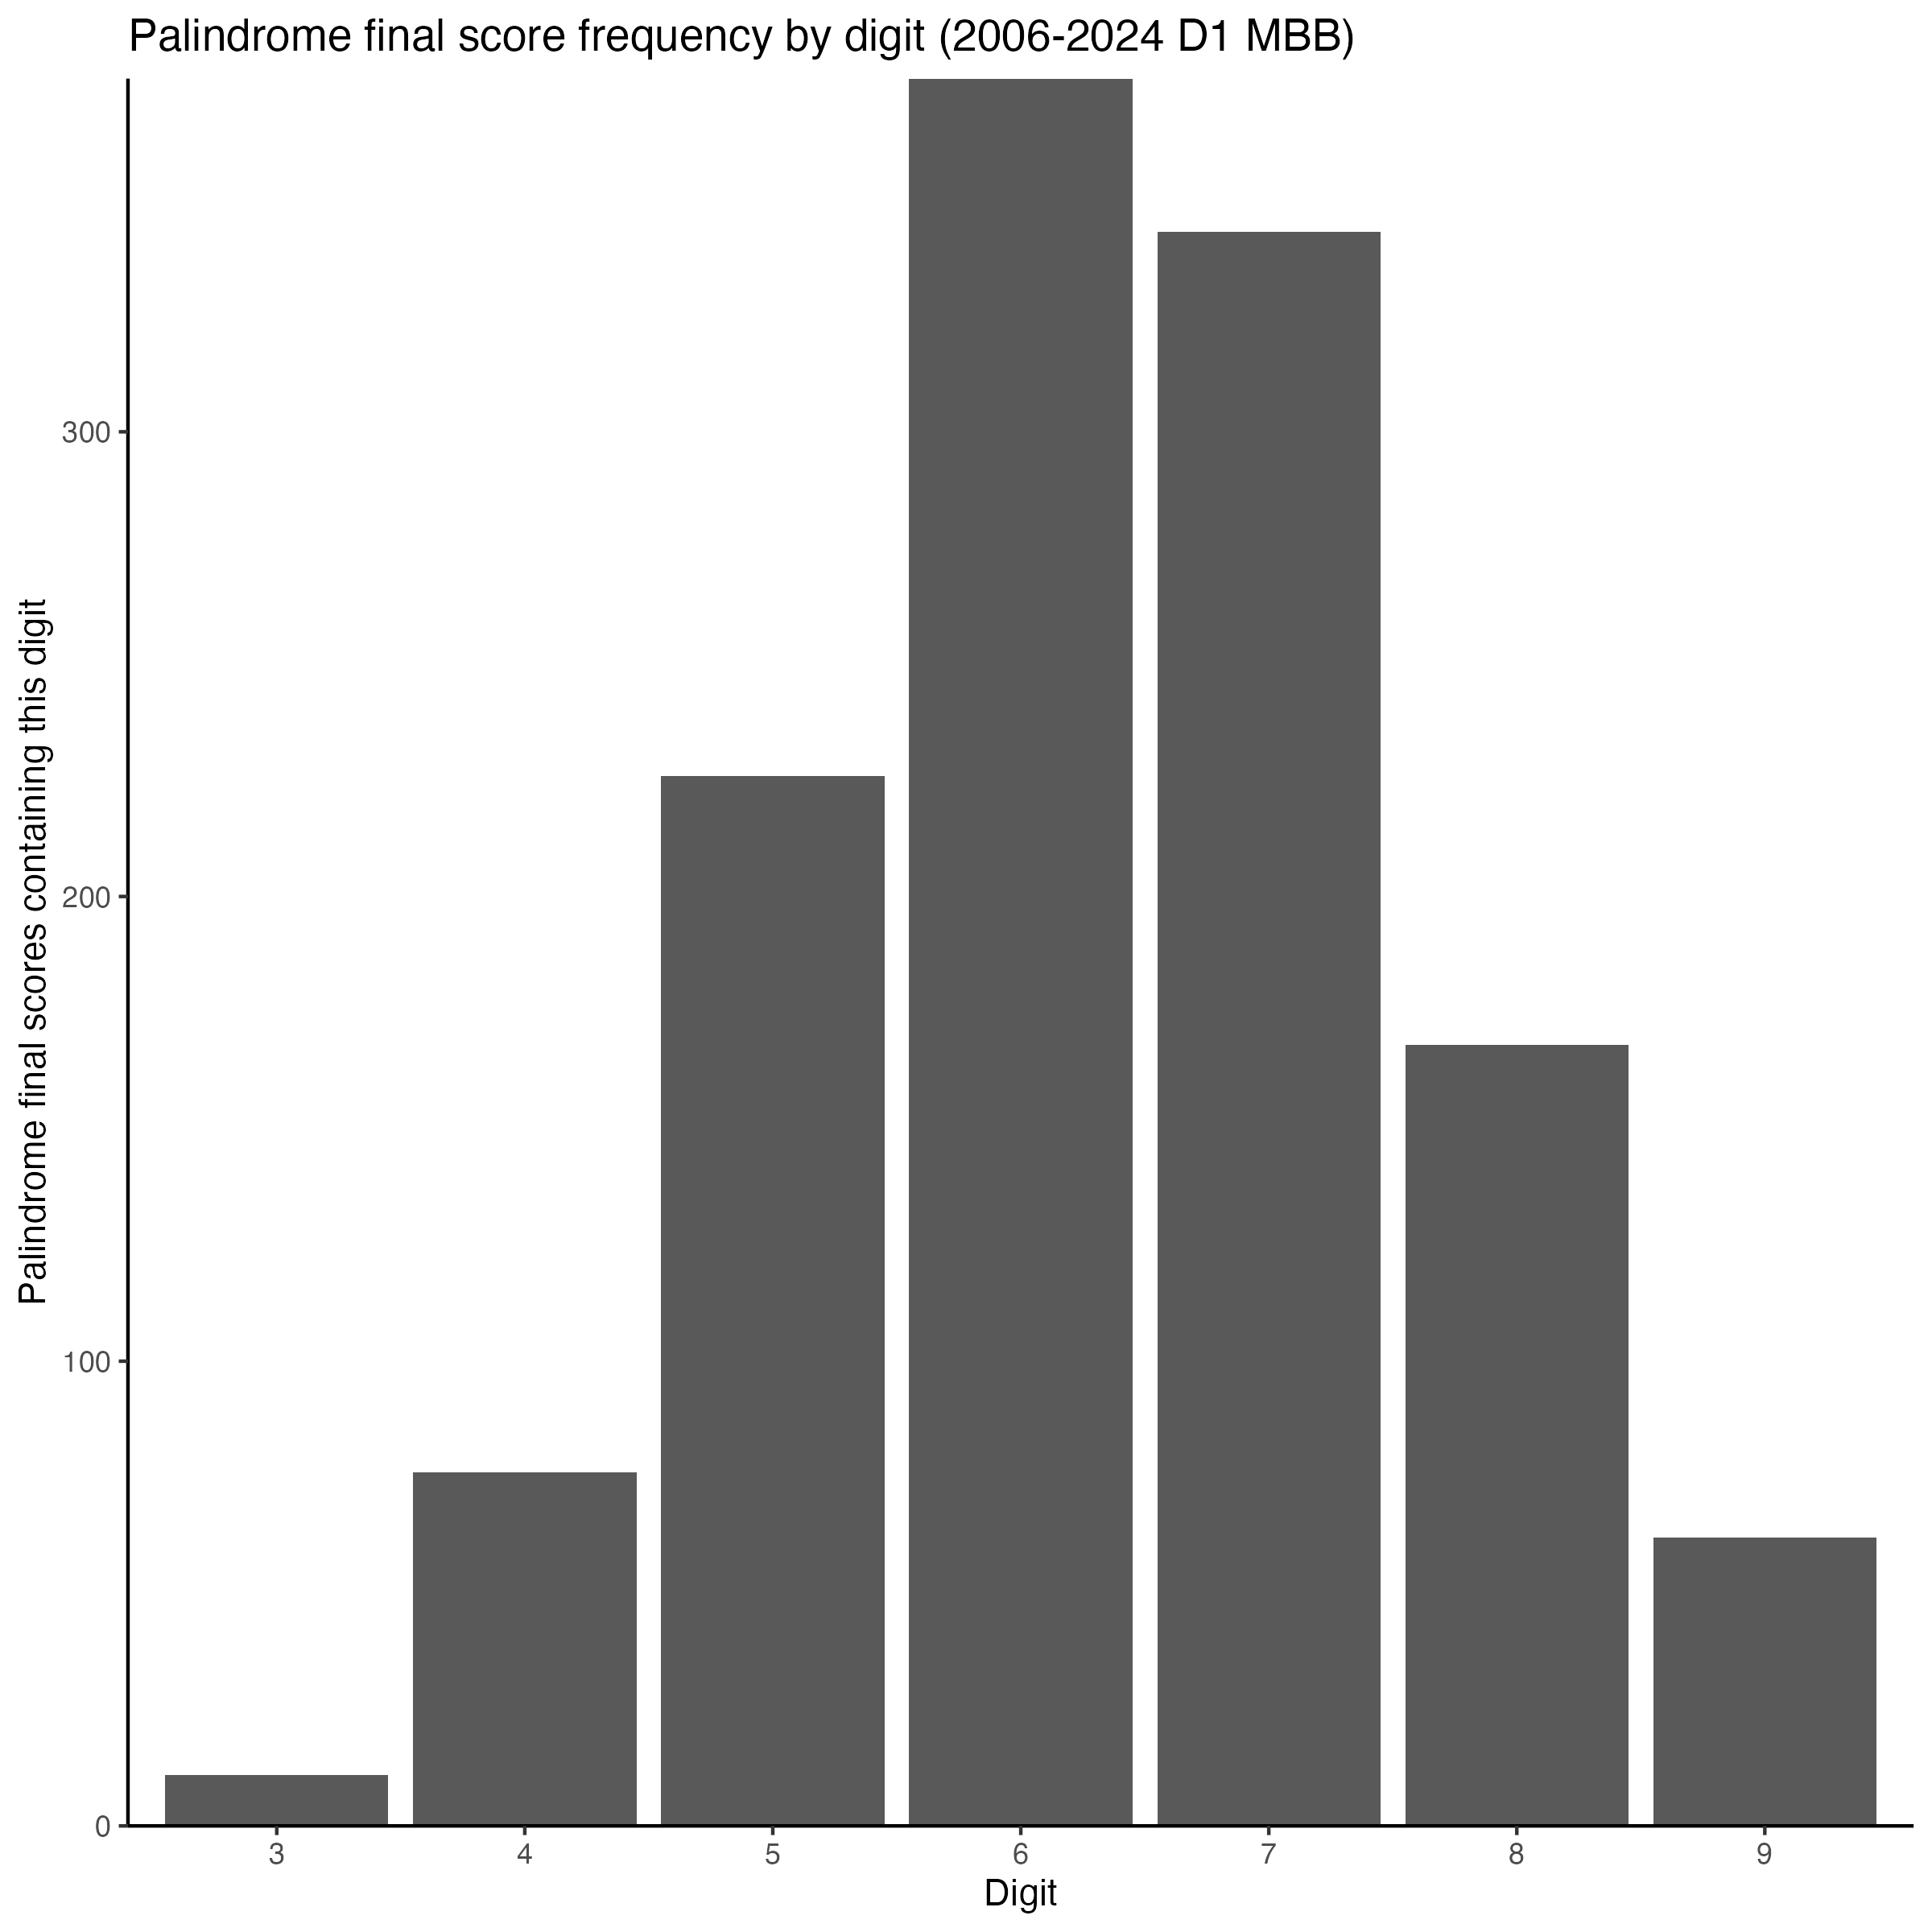
We can also ask: which digits tend to show up in palindrome scores? By extracting every nonzero digit from every palindrome score-game pair, we get:
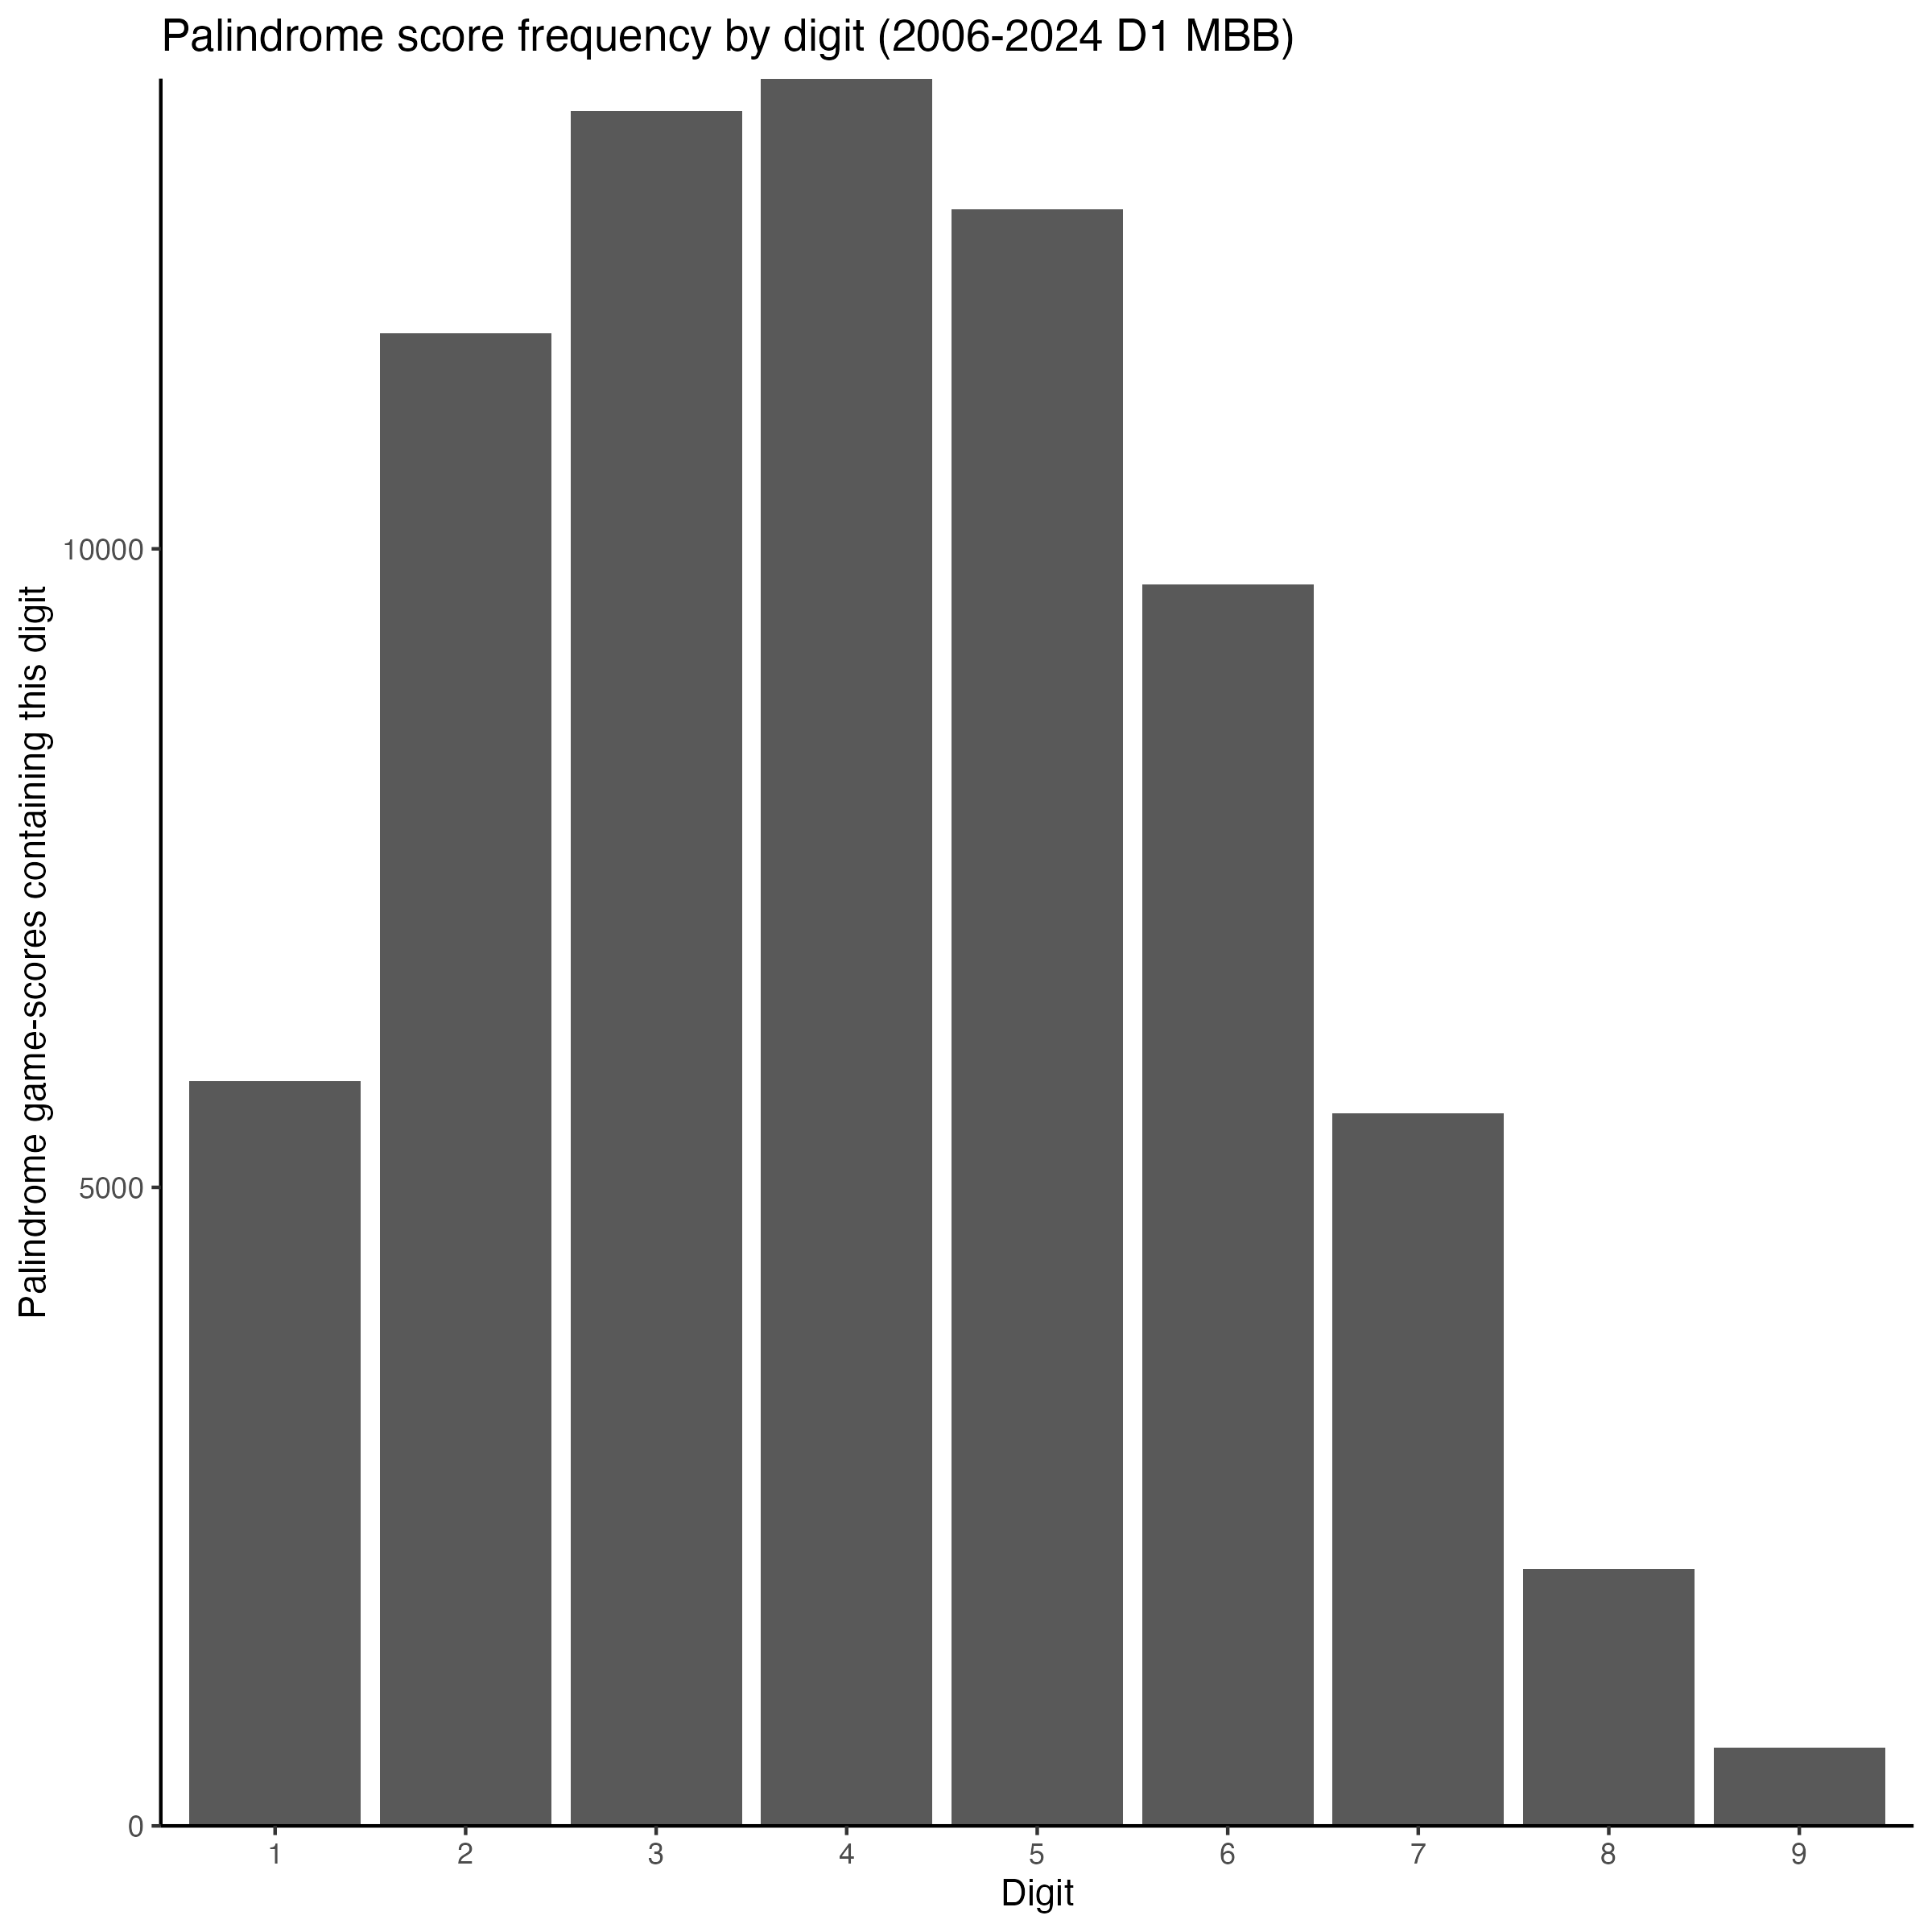
Digits 3, 4, and 5 dominate. This again reflects where in a basketball game palindromes are most likely to happen: the 30s, 40s, and 50s represent the sweet spot where both teams have enough points for two-digit scores but the game hasn’t stretched into blowout territory. The falloff toward 8 and 9 reflects the rarity of high-scoring palindromes.
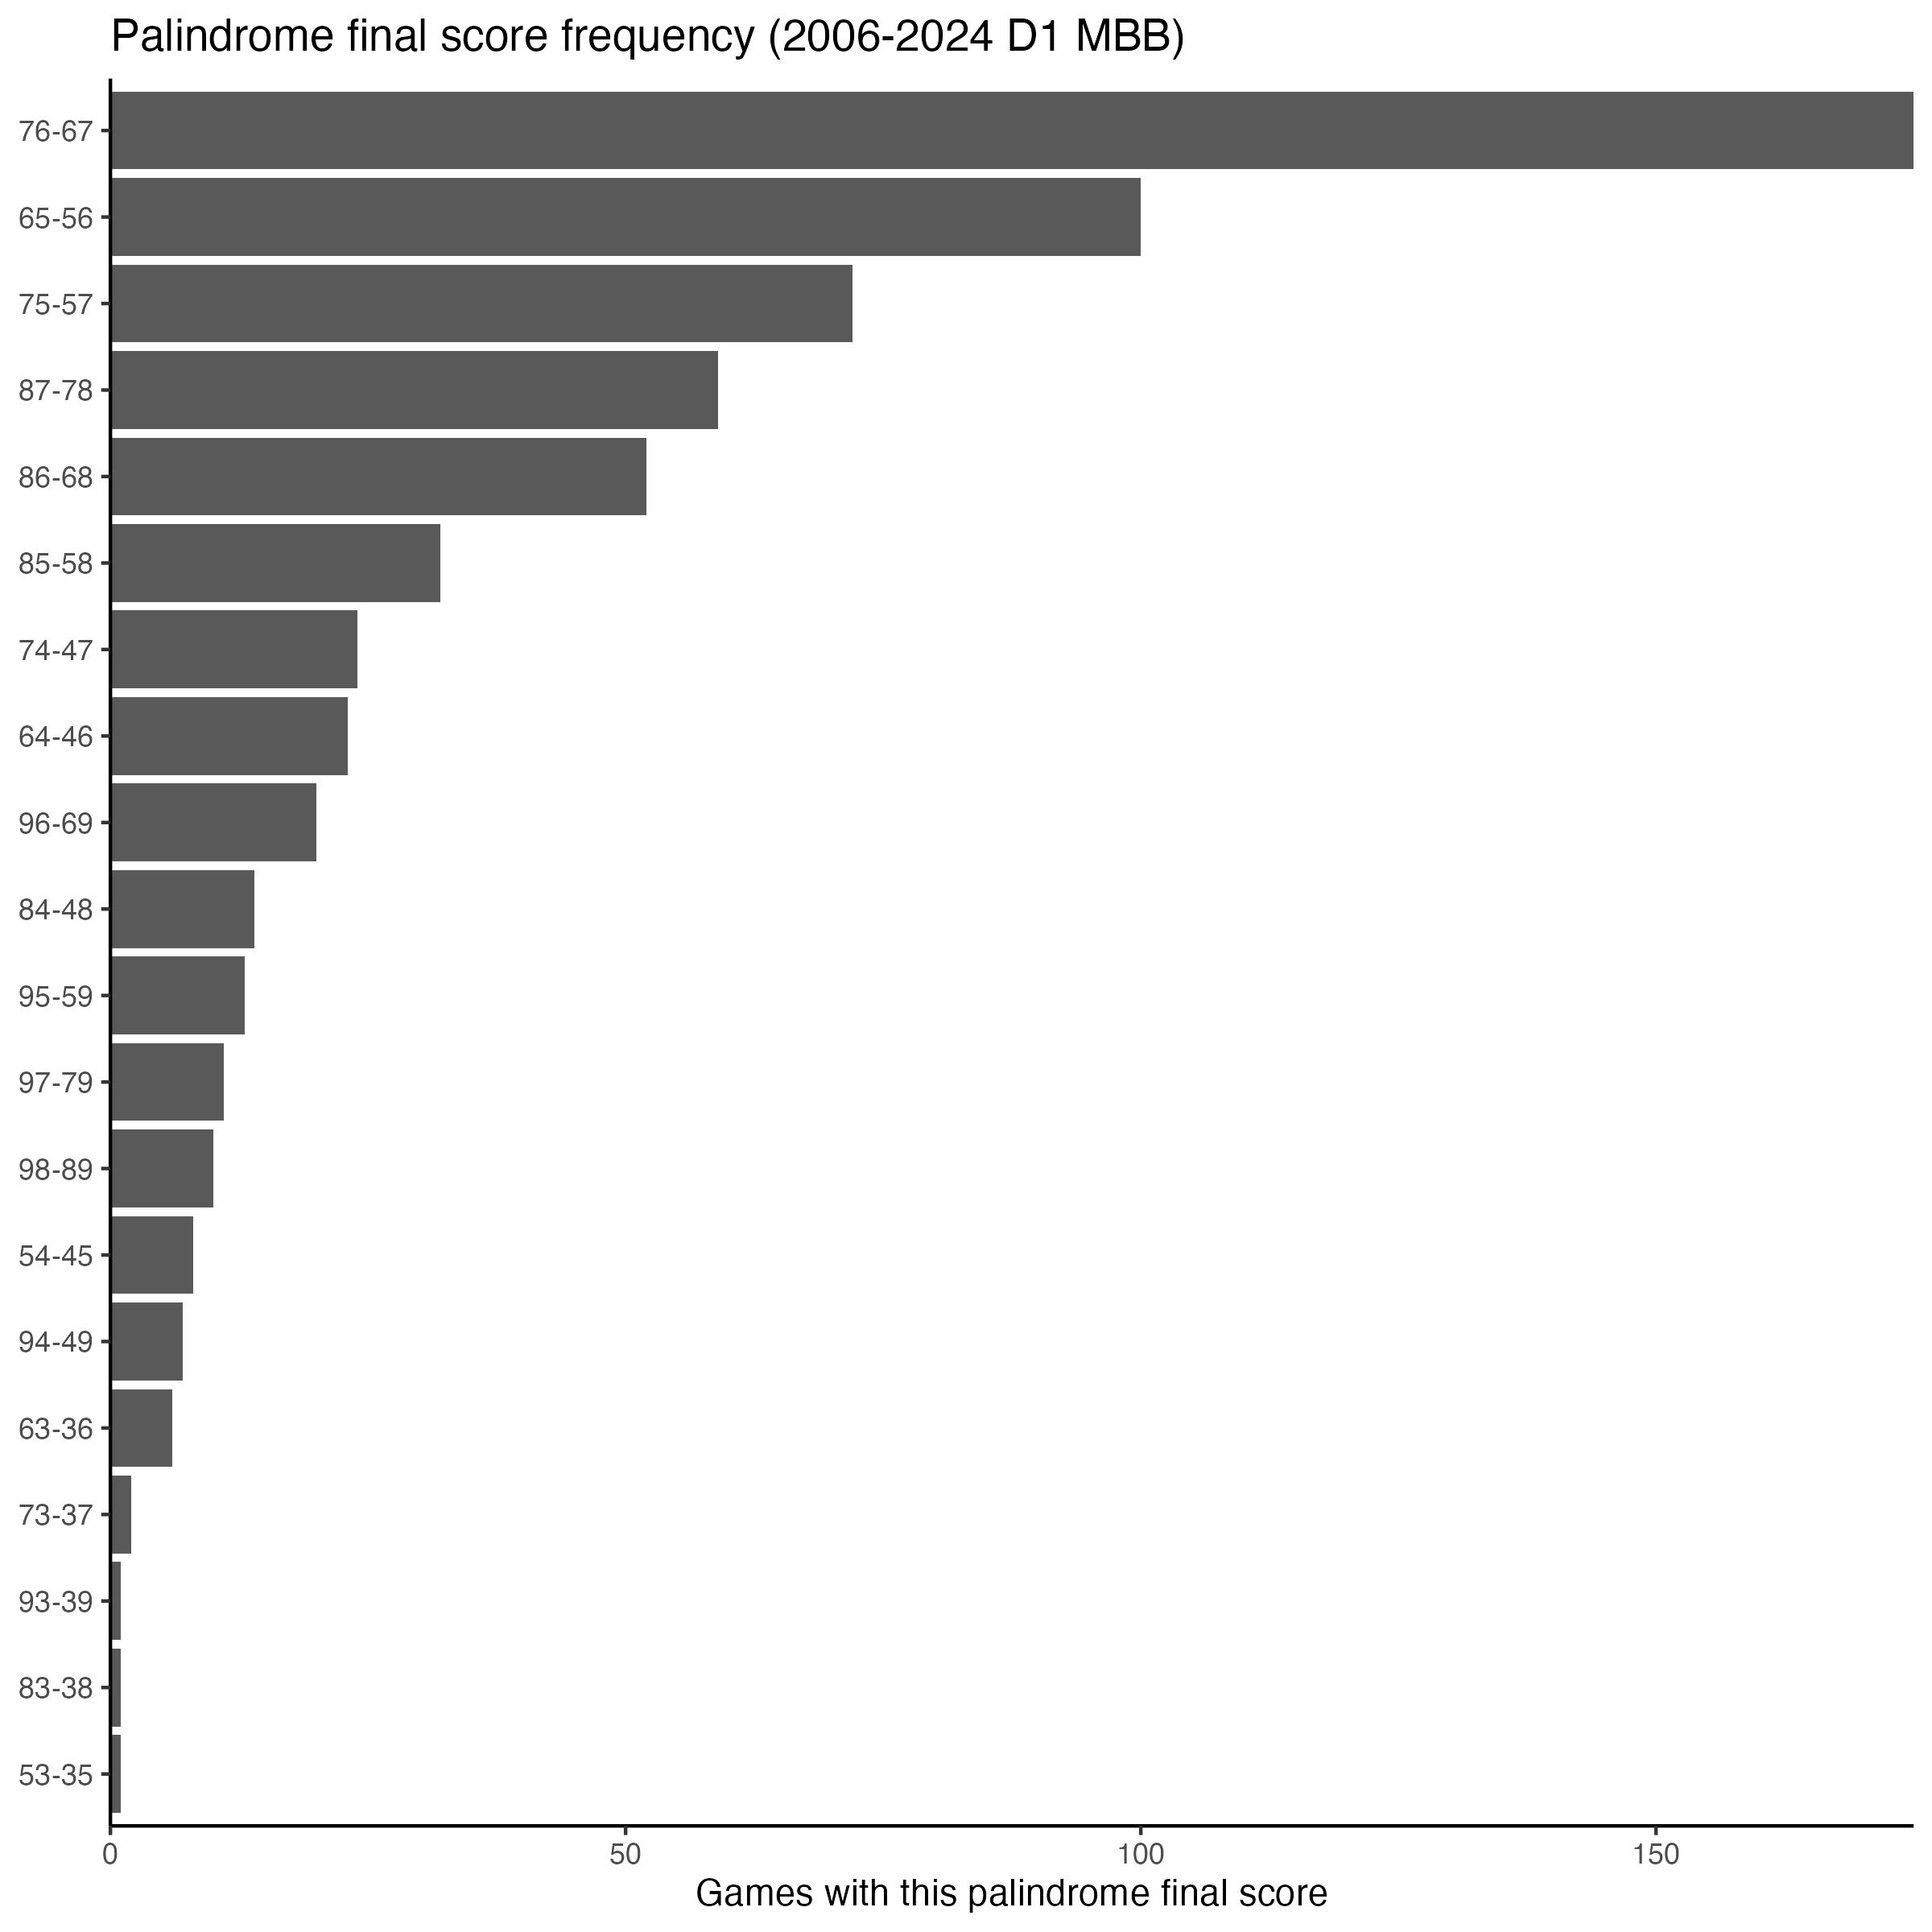
When we instead consider only palindrome final game scores (631 of them!), the picture changes, unsurprisingly. Only 20 of the 36 possible palindromes appear as final scores at all, and the distribution shifts upward into the ranges where games actually end. 76-67 dominates with 175 occurrences, followed by 65-56, 75-57, and 87-78. Correspondingly, the digit distribution shifts: 6 and 7 become the most common digits, with 5 and 8 close behind, and 3 and 9 barely registering.
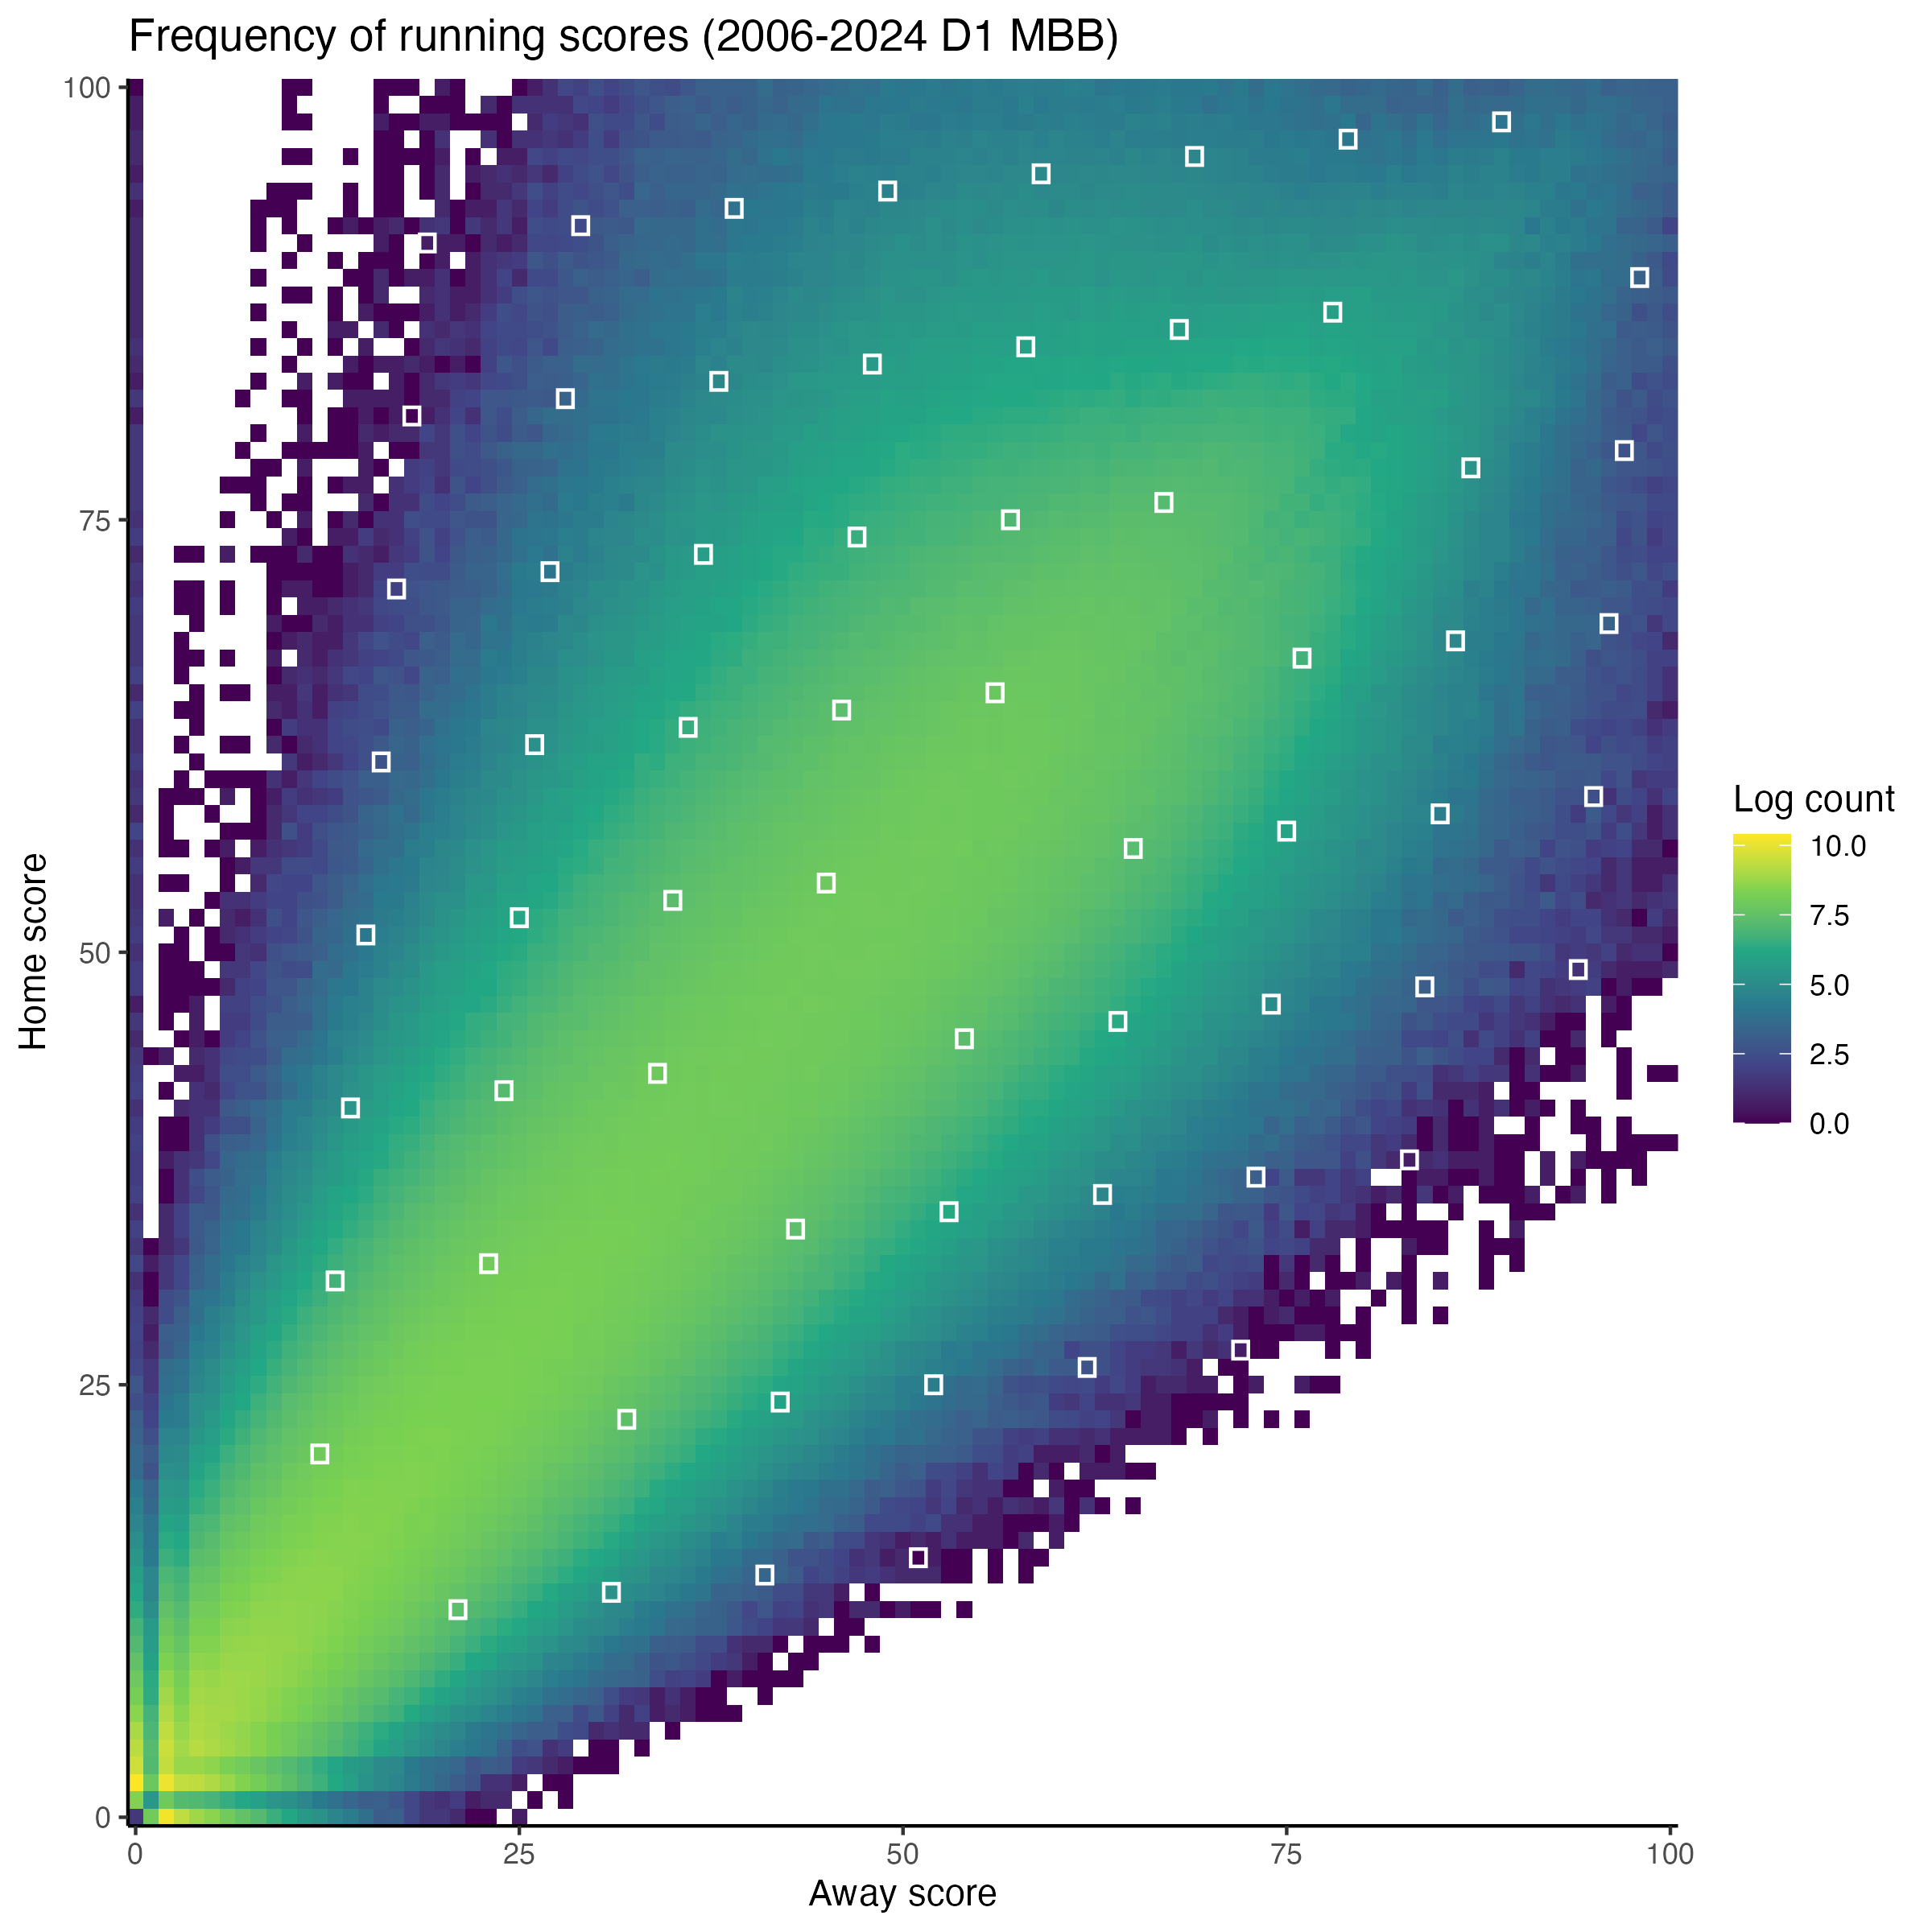
As alluded to, all of these patterns reflect the broad distribution of overall NCAA basketball scoring patterns, which I show below, with the palindromes highlighted in white. I am skeptical about some data entry issues (UC Santa Cruz did not have a moment where they were up 100-0 against UC Davis on November 18, 2007), but despite the outliers the overall picture seems broadly plausible.
Finally, for more fun: which teams have played in the most games that passed through a palindrome score? This is mostly a proxy for “which teams play the most games” (and therefore have the most chances), which is itself a proxy for which programs have been consistently good enough to make deep tournament runs and play in televised games over this period, but maybe there is maybe some variation to assess amongst the top!
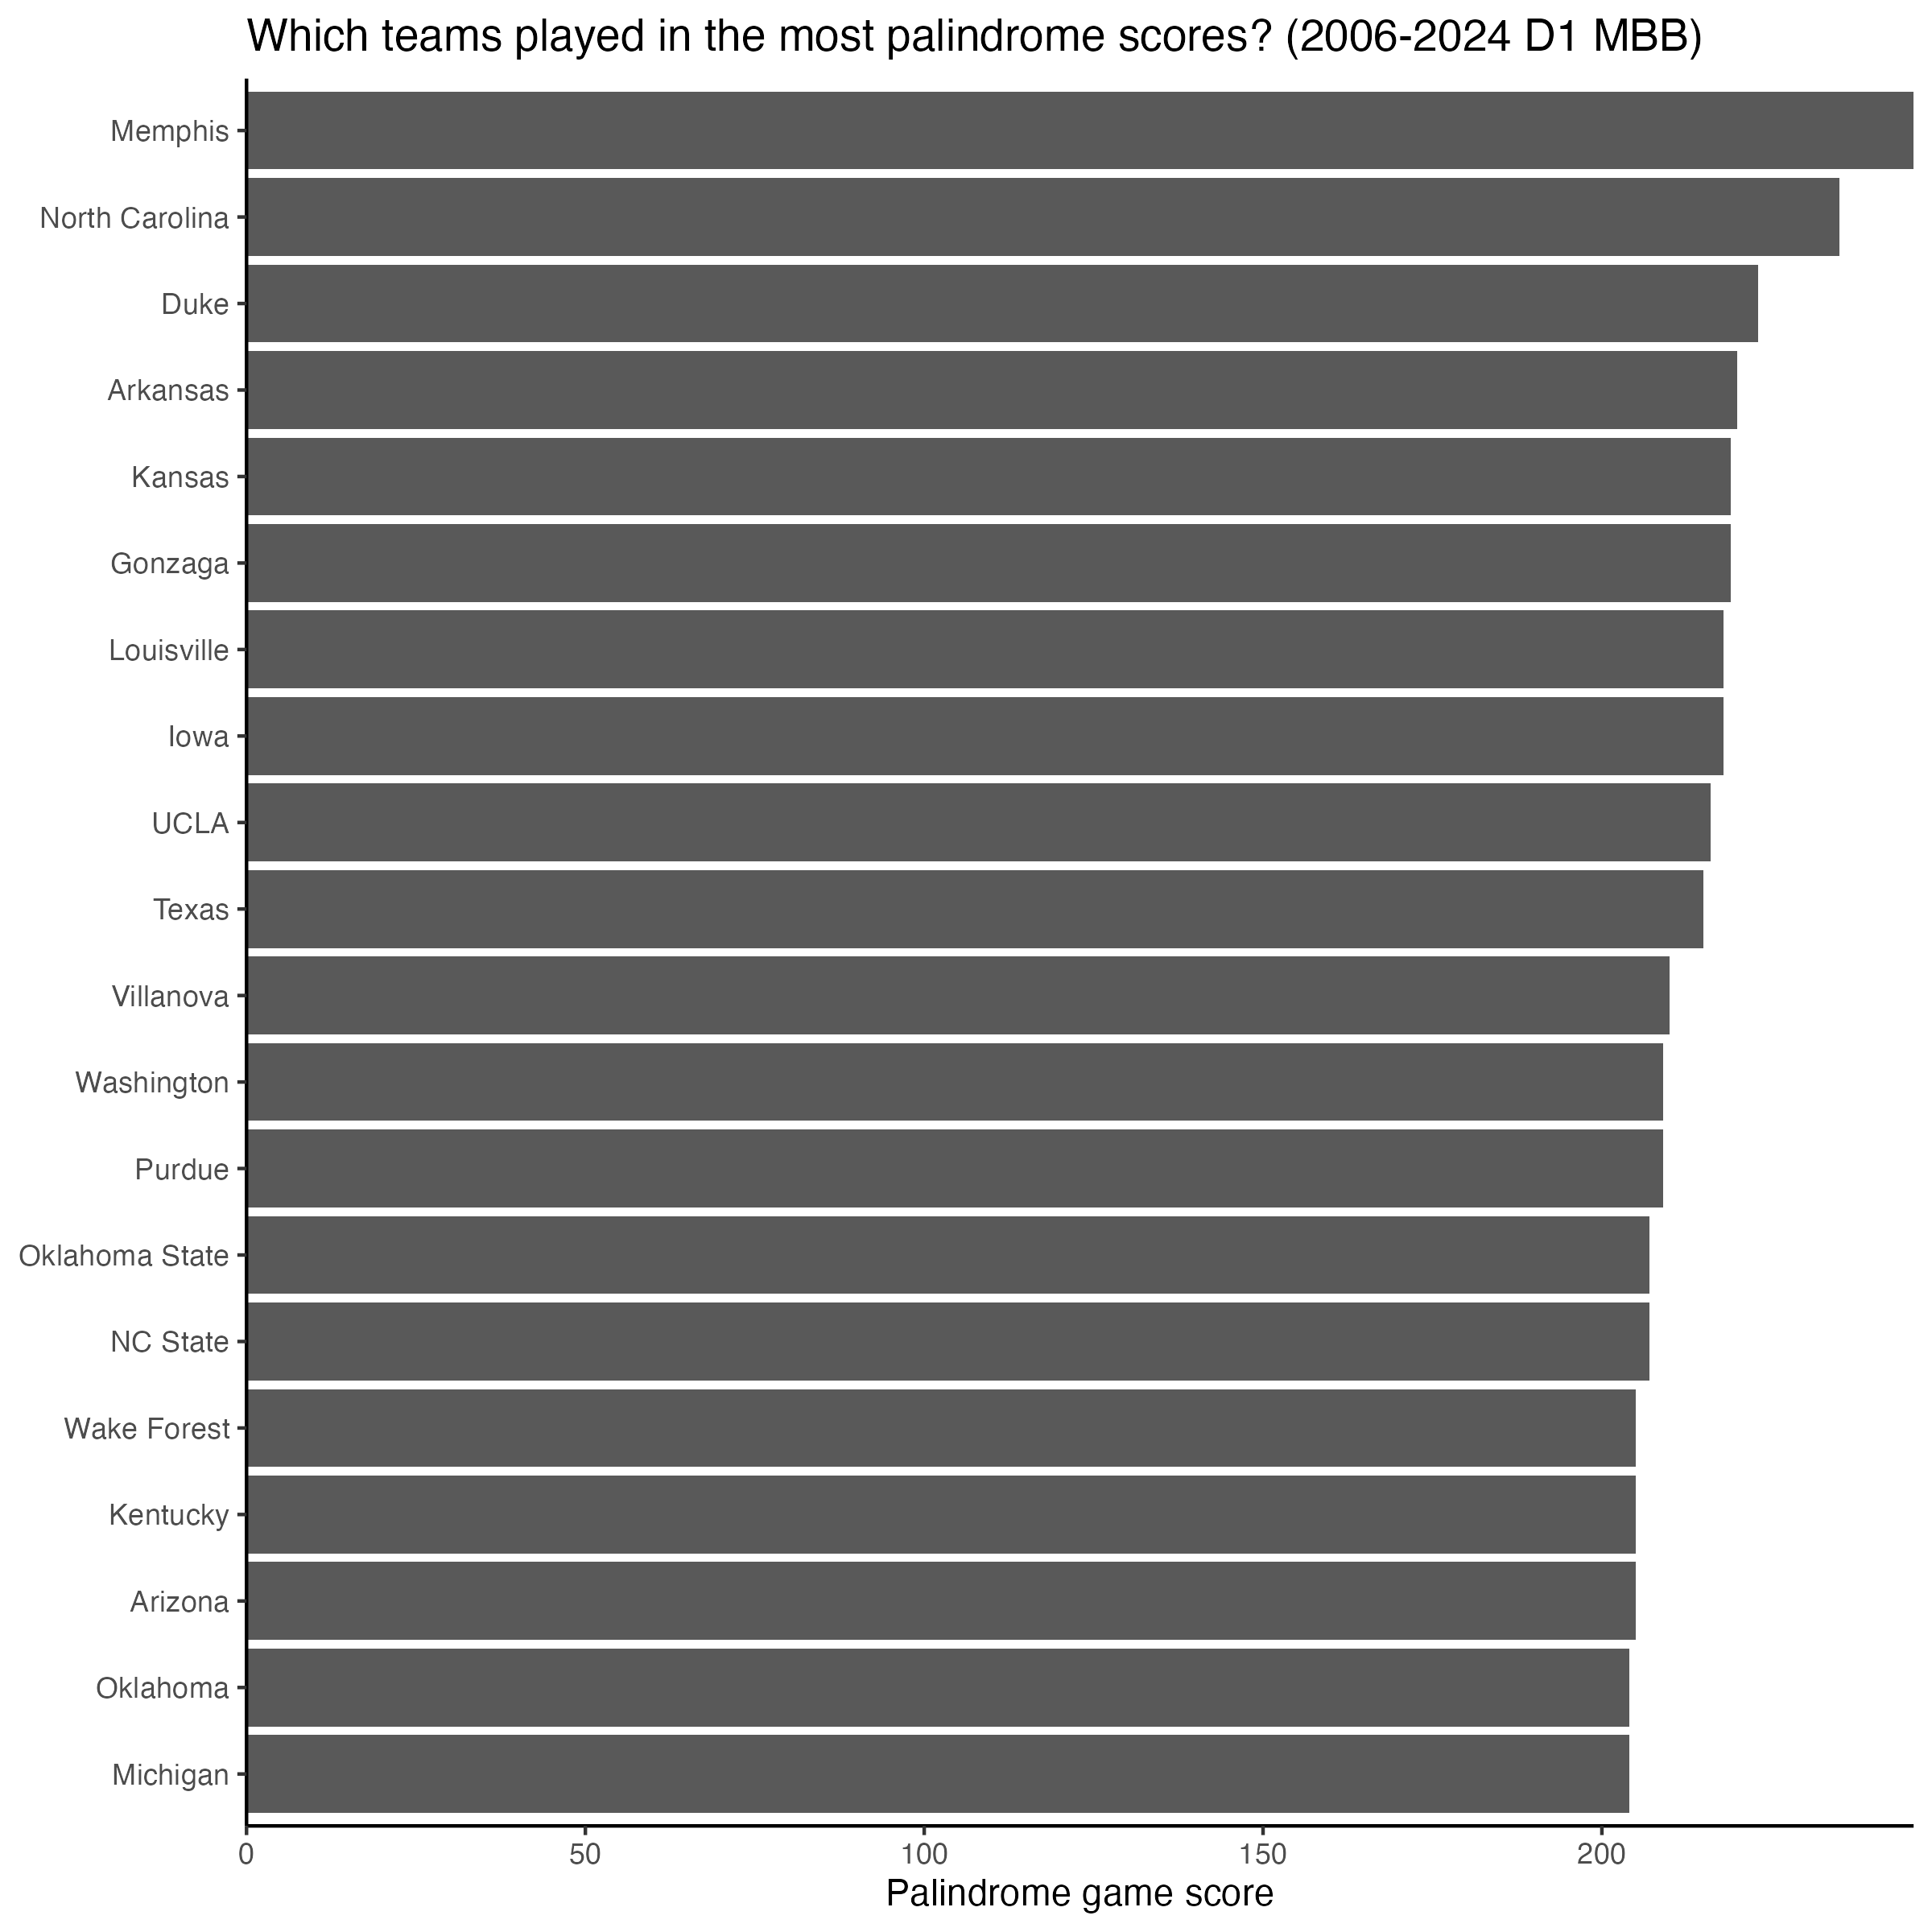
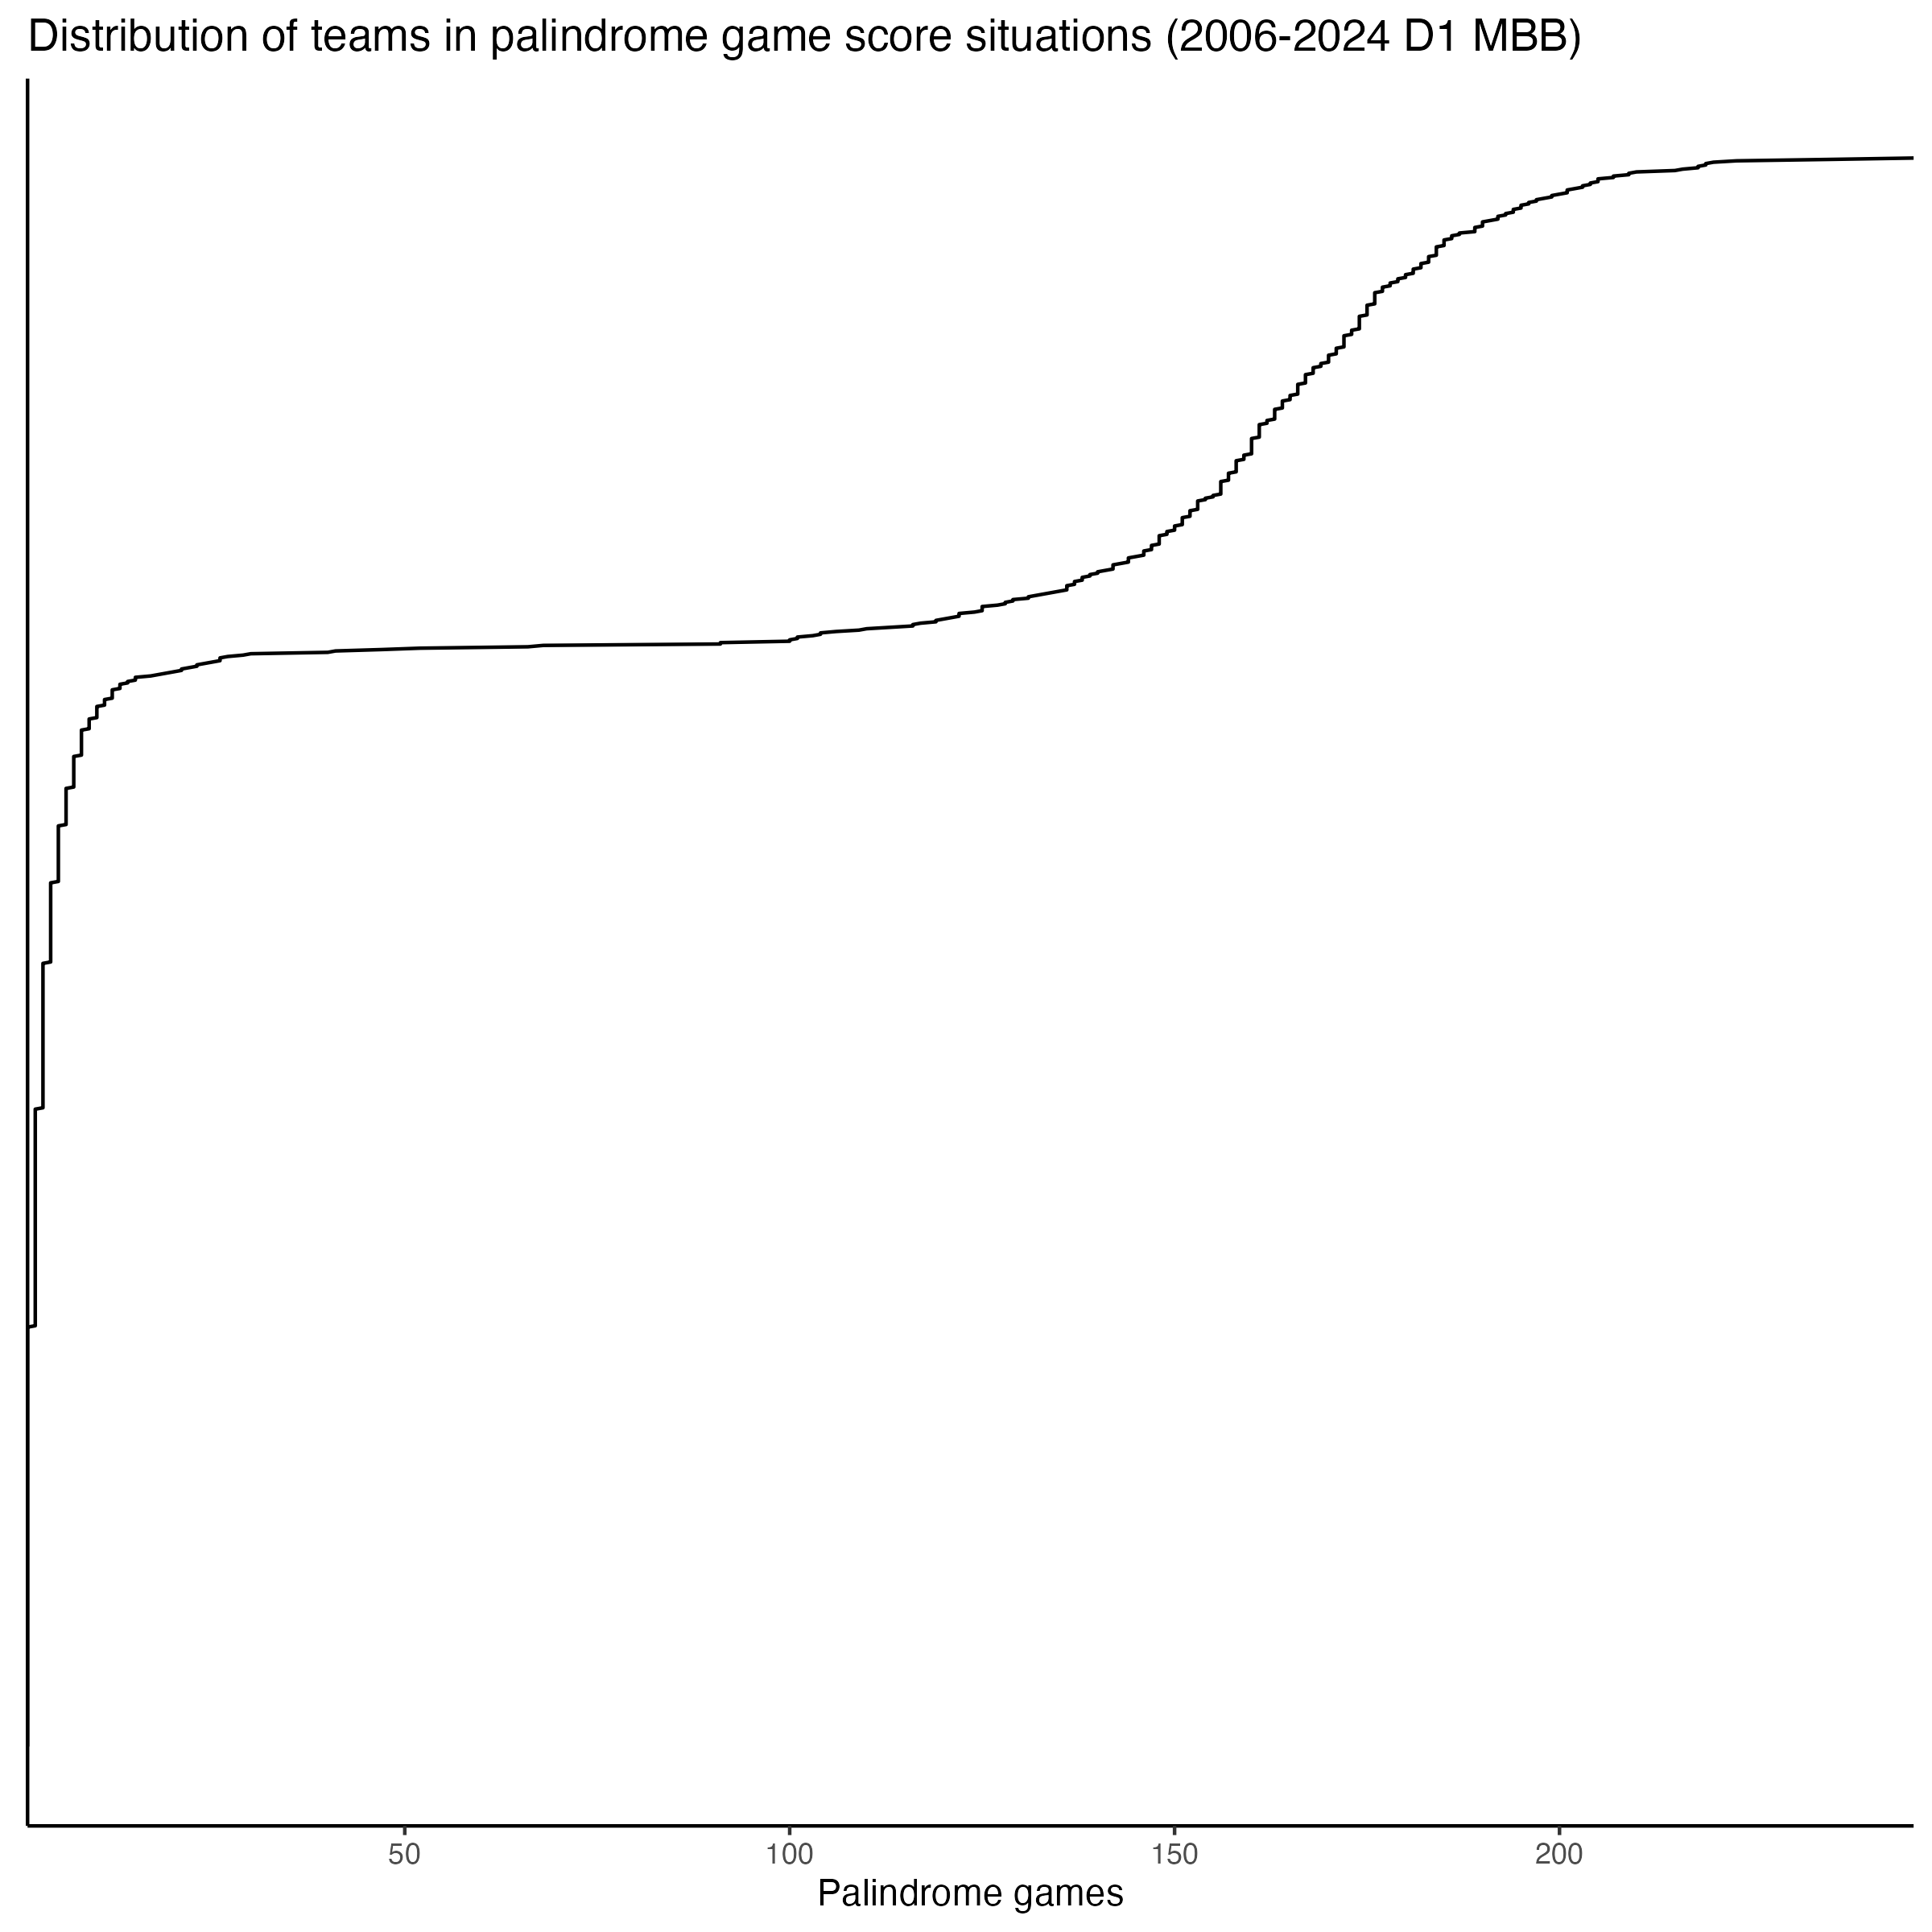
Memphis, North Carolina, and Duke lead the way, none of which is surprising. But Memphis has been in 246 palindrome score situations, fully 11 and 23 more than its followers. The full distribution of all teams is pretty funky looking but shows the expected long tail:
This is clearly a silly exercise, but I think it illustrates a few things nicely. First, the hoopR package is really excellent and easy to use. Second, the palindrome frequency distribution is a fun way to visualize the underlying structure of how basketball games flow: scores concentrate in certain ranges, gaps between teams follow predictable patterns, and extreme blowouts are rare enough that certain score combinations barely exist in 19 years of data.
You might wonder about Michigan’s 74-47 moment against Arizona? That palindrome appears in about 800 games in the dataset. Not the rarest palindrome, but not exactly common either—well-suited for a game where one team was putting on a historically dominant performance.
comments powered by Disqus